Qlik vs. Power BI: which of them to choose
Learn about Qlik Sense and Power BI. A comparison on UX, data management, visualizations, integrations, security and pricing to choose the BI platform that best suits your business.
.png)
Qlik vs. Power BI: A Brief Introduction
Qlik vs Power BI is the comparison between Qlik Sense (Qlik’s associative analytics platform, known for its unique in-memory associative engine that surfaces hidden relationships in data) and Microsoft Power BI (Microsoft’s cloud BI platform integrated with Microsoft 365). Power BI leads on pricing, Microsoft ecosystem integration, and DAX flexibility; Qlik leads on associative exploration, data lineage visibility, and large-scale, self-service analytics for technical users.
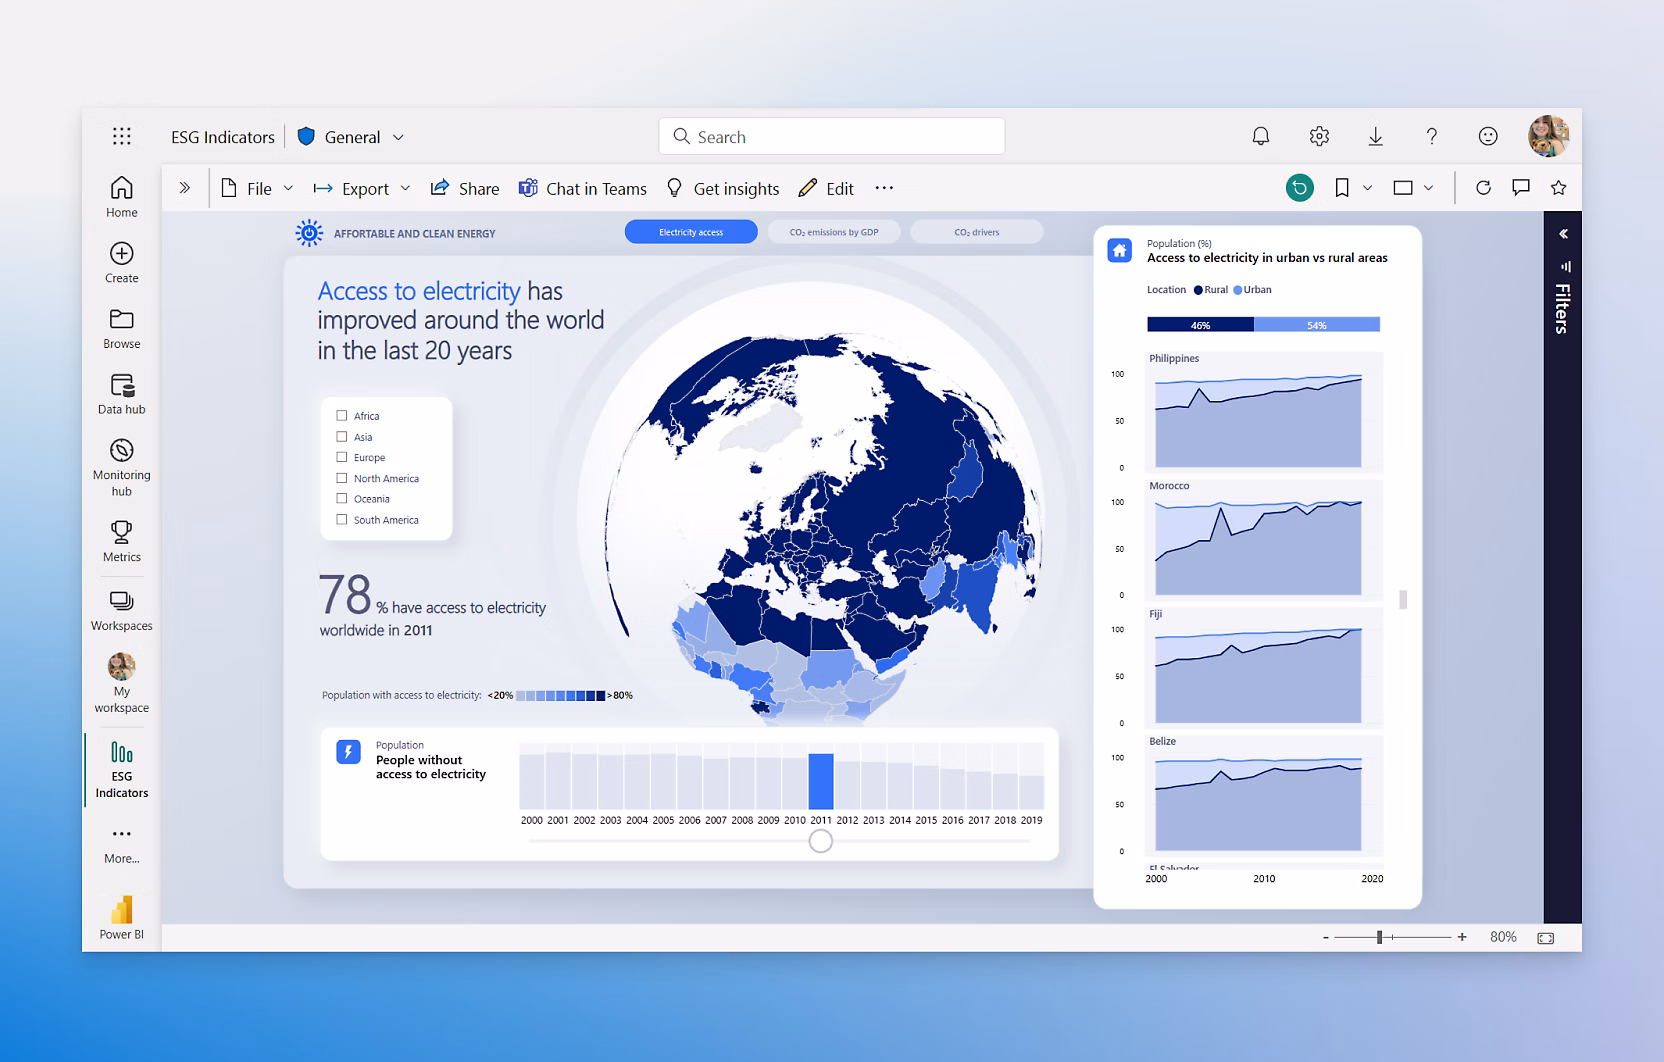 Power BI’s Home Page
What are Power BI and Qlik Sense
To begin with, let’s start by presenting the two tools individually and see what they have to offer before moving on to a more direct comparison.
Microsoft Power BI
Power BI is a business intelligence software developed by Microsoft, the famous technological giant that over the years has transformed the corporate work landscape with its tools for office work.
Launched in 2014, Power BI has quickly established itself as one of the leaders in the Business Intelligence sector, thanks to a combination of ease of use, versatility and constant innovation. Its close integration with other Microsoft products, such as Excel, Azure, Teams and SharePoint, has then made it particularly attractive for organizations already part of the Microsoft ecosystem.
Power BI allows users to connect to a wide variety of data sources, to transform and model data with intuitive tools, and to create interactive reports and dynamic dashboards. In addition, it offers advanced artificial intelligence, predictive analysis and collaboration capabilities, accessible even to non-technical users. This combination of accessibility and power has helped make it the most used BI solution globally, both by small businesses and large multinationals.
It excels in areas such as:
- Advanced data analysis: Advanced analysis capabilities allow you to seamlessly perform data modeling and advanced measurement, making it easy to identify trends and opportunities from business data.
- Data visualization: Power BI allows you to create interactive and engaging dashboards and reports from a variety of data sources. It offers a wide range of customizable visualizations to represent data and its evolution (pie chart, map, histogram, etc.) in a clear and engaging way.
- Data sharing and collaboration: Microsoft’s BI solution also facilitates collaboration between business teams. You can share reports and dashboards with other users in a few clicks.
- Integration with other Microsoft tools: Power BI easily integrates with other Microsoft products. For example, you can easily import and manipulate data from Excel or share reports and dashboards through SharePoint (business dashboard, accounting dashboard, social dashboard, etc.).
Qlik Sense
Qlik Sense is the evolution of QlikView, one of the most used Business Intelligence (BI) tools in recent years. It’s considered simple to use on the interface front, intuitive, and popular enough to have carved out a prominent place in the BI landscape.
Developed by Qlik, Qlik Sense is based on a associative engine that allows you to combine data from different sources, facilitating non-linear discoveries and insights that would be difficult to obtain with traditional query-based tools.
Qlik Sense offers dynamic dashboards, customizable views and augmented intelligence functionality, making data analysis accessible to both technical and non-technical users, in a self-service but controlled environment. It is available both in version Cloud which on-premises, supporting modern and collaborative analysis scenarios.
The platform has several essential advantages for those looking for a simple but functional BI solution:
- IT is rapid, making it much less frustrating than other available solutions.
- It allows multi-user access right away, ensuring immediate scalability.
- It has a untechnical frontend, which translates into an excellent usability for everyone.
- Take a not guided approach, leaving more freedom for the user (although this may not appeal to everyone).
- IT is stable and offers a smooth and efficient user experience.
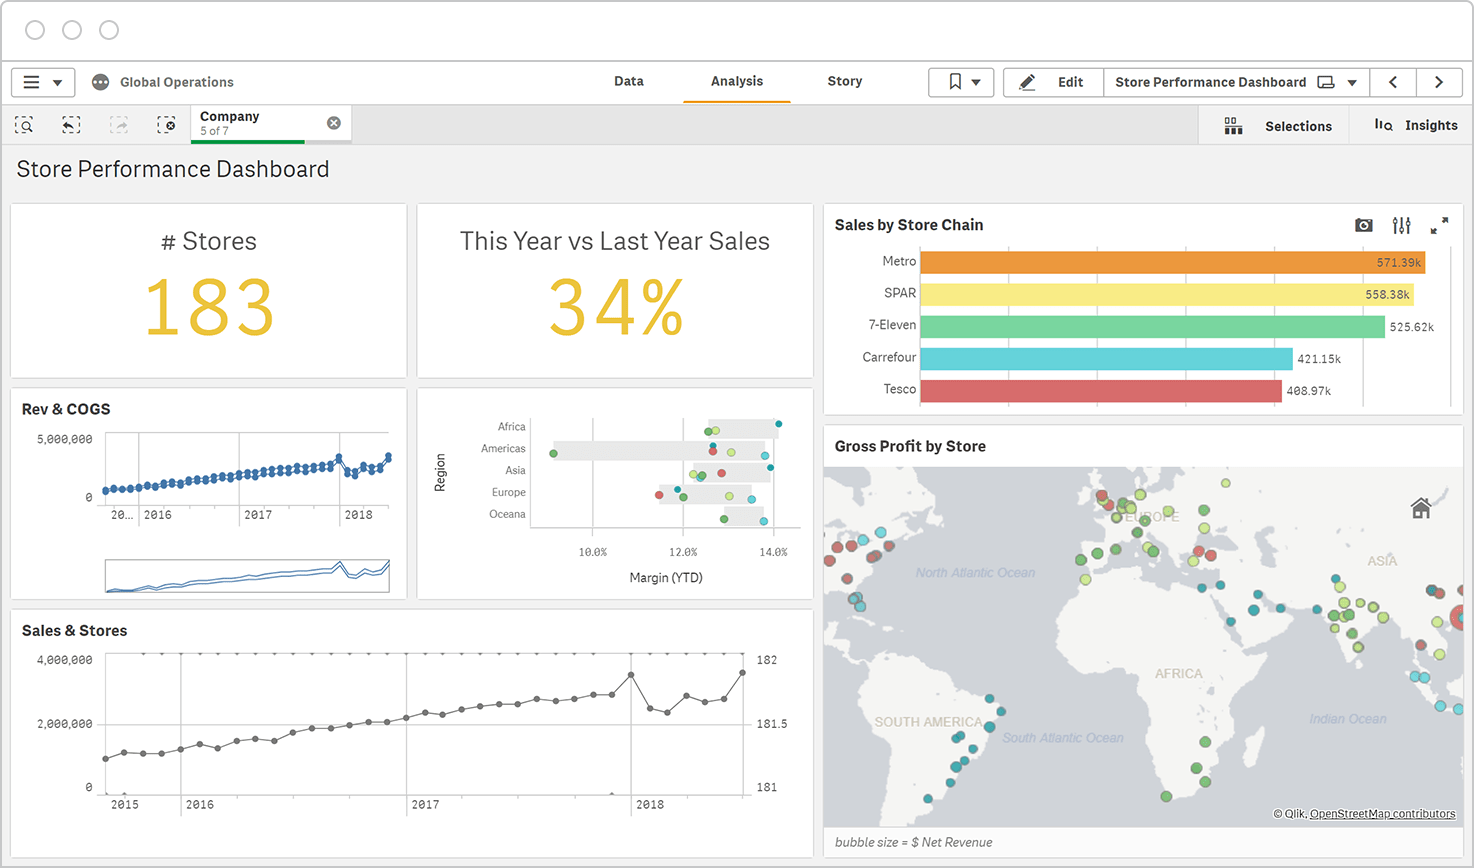
 Qlik Sense’s dashboard
Qlik vs. Power BI: the two compared
Now that we have a little clearer about the main characteristics of the two tools, the time has come to put them next to each other and see how they behave in the key areas affecting a Business Intelligence tool worthy of the name.
UI and user experience
Qlik Sense offers a clean and minimalist interface, built around its unique associative data model. The platform favors self-service analysis through a drag-and-drop system that automatically highlights relationships between data.
A distinctive element is the ability to dynamically explore data, visualizing associated and unassociated data through a color coding in green, white and gray.
Let’s see in the table below some of the features aimed at improving the user experience:
| Feature | Description |
|---|---|
| Smart Search | Intelligent search that lets you search across all data within an app |
| Centralized hub system | All apps, sheets, and stories are accessible from a single location |
| Responsive design | Visualizations automatically adapt to different screens and devices |
| Advanced filters | A selection bar that shows active filters and their logical relationships |
Power BI has a ribbon-style interface (ribbon) familiar to Windows and Microsoft Office users. It integrates perfectly with other Microsoft products, making it particularly suitable for organizations already immersed in that ecosystem. The workspace system encourages collaboration between teams in sharing and reviewing reports.
As with Qlik Sense, we see in the table below some of its key features in this area:
| Feature | Description |
|---|---|
| AI-powered Q&A | Allows users to ask questions in natural language and get instant visualizations |
| Intuitive drag-and-drop interface | Ribbon menu with all functions organized by category |
| Rich contextual menus | Direct access to formatting and analysis options from within visualizations |
| Customizable navigation panes | Can be tailored to preferences and frequently performed tasks |
Data management skills
Qlik Sense uses its proprietary associative engine, which automatically maintains relationships across all data points. This in-memory–based approach allows users to explore data from any angle without having to define hierarchies or relationships in advance. The platform compresses data to up to one-tenth of its original size, enabling fast processing of large volumes of information.
In addition, it supports more than 40 direct data connectors, including databases, file systems, and cloud services, and provides powerful ETL capabilities with integrated data profiling and intelligent data preparation. It also offers script-based data modeling through Qlik’s proprietary expression language for complex transformations and includes incremental load functionality that updates only modified data, optimizing refresh performance.
Power BI, on the other hand, uses a columnar database engine optimized for both in-memory and disk-based analytics. The platform leverages Microsoft’s extensive data ecosystem and provides a robust modeling system based on relationships and DAX (Data Analysis Expressions).
In addition, it offers more than 120 native data connectors with regular updates for new sources, Power Query for visual ETL using the M language for advanced transformations, Dataflows for centralized data preparation and reuse across reports, and DirectQuery mode for real-time analytics without importing data.
Data visualization
Power BI offers a rich library of visualizations with a strong focus on aesthetics and interactivity. The platform provides both native and custom visuals through the AppSource marketplace. Key capabilities include more than 50 built-in visualization types (with hundreds more available in the marketplace), AI-driven visualization recommendations based on data type, advanced formatting controls with pixel-perfect positioning, and powerful cross-filtering and drill-through features.
Qlik Sense focuses on interactive visualizations that dynamically respond to user selections. The platform’s associative model ensures that each chart automatically updates to display related data, providing continuous analytical context. Qlik Sense offers more than 30 native visualization types with extensive customization options, intelligent visuals that automatically suggest the most suitable chart type, custom themes with support for extensions for branded visualizations, and advanced mapping capabilities with integrated GeoAnalytics.
 Power BI’s data visualization
Analytics
Power BI leverages Microsoft’s artificial intelligence and machine learning capabilities to deliver sophisticated analytics tools that are also accessible to business users. It includes native AI capabilities through AI Insights, integration with Azure Machine Learning, Quick Measures for common advanced calculations, and automated machine learning tools for predictive analytics.
Qlik Sense, on the other hand, integrates advanced analytics capabilities directly into its associative engine, enabling complex calculations and statistical analysis without leaving the platform. It offers built-in statistical functions and advanced aggregations, deep integration with R and Python for analytics, set analysis expressions for complex cohort analysis, and predictive analytics through Qlik AutoML capabilities.
Development and customization
Regarding the development aspect, Qlik Sense offers a robust environment that balances ease of use and powerful customization options. The mashup and extension capabilities of the platform allow for extensive customization like Open APIs for custom development and integration, web mashup integration capabilities for embedded analytics, custom visualization extensions using standard web technologies, and support for version control and DevOps integration.
Power BI emphasizes development within the Microsoft ecosystem, offering deep integration with TypeScript for custom visual development, the Power BI Embedded analytics platform, Azure DevOps for deployment, and the DAX and M languages for advanced customizations.
Compatibility and integrations
Power BI excels in integration with the Microsoft ecosystem, offering native connectivity with Azure services and Office 365 applications, while also supporting third-party integrations. It provides seamless integration across the entire Microsoft stack (Excel, Azure, and SharePoint), custom data connectors through the Power Query SDK, embedded analytics via Power BI Embedded, and native integration with Microsoft Teams and Microsoft 365.
Qlik Sense, by contrast, takes a platform-agnostic approach to integration, offering flexible deployment options and strong compatibility with a wide range of systems. Its open architecture enables seamless integration with existing enterprise systems. For example, it provides enterprise-grade APIs supporting REST and WebSocket protocols, native connectors for major enterprise systems such as SAP and Salesforce, support for both Windows and Linux deployment environments, and the ability to develop custom connectors using the Qlik Connector SDK.
Security and Compliance
Qlik Sense implements a comprehensive security framework with granular controls and robust authentication options, making it suitable for highly regulated industries. Among the main features are Section Access for row- and column-level security, support for multiple authentication methods (SAML, JWT, LDAP), detailed audit trails and security reporting, and compliance with ISO 27001, SOC 2 Type II, and HIPAA.
Power BI, on the other hand, exploits Microsoft’s famous and robust enterprise security infrastructure and offers numerous compliance certifications through the Azure security framework in addition to Row-level security through DAX expressions, integration with Microsoft Enter ID, encryption at rest and in transit, and multi-factor authentication (MFA) for more secure access. It also provides threat monitoring and detection through Microsoft Defender, role-based access control (RBAC), and centralized security policy management via Endpoint Manager.
Support for users
A digital tool is only as effective as the support available to its users, and both platforms provide a range of options to support their respective communities.
Qlik maintains an active user community and offers comprehensive support options, although its community is smaller than Power BI’s. Available resources include the Qlik Community Forum with active user participation, official training through Qlik Continuous Classroom, a partner network for local support and implementation, and direct assistance via Qlik Enterprise Support.
Power BI, on the other hand, benefits from Microsoft’s vast user base and partner ecosystem, offering one of the broadest ranges of community support options. These include a large global community with active forums, monthly updates and feature releases shared through Microsoft blogs, extensive documentation and learning paths on Microsoft Learn, and a wide network of certified partners and consultants.
 Qlik Sense’s user support
Qlik vs Power BI: Pricing and Licensing
After the comparison on the capabilities of the two, let’s dedicate a separate section to one of the most important aspects that can determine the choice between one of the two solutions, namely the cost.
In the following tables, we have summarized the main licensing plans of each of the two platforms, their cost in dollars and some of their most important main characteristics to outline the overall picture as clear as possible. As always, if you would like more detailed information, please consult the respective dedicated pages on the websites of the two companies.
| Plan | Price | Description |
|---|---|---|
| Standard Plan | $825 per month | This plan is designed for small teams or groups that need basic analytics capabilities. It includes 25 GB of data and access for 20 full users, billed annually. |
| Premium Plan | $2,750 per month | This plan provides advanced features for organizations that need to scale analytics to larger teams. It includes 50 GB of data and access for 20 full users, billed annually. The Premium plan is designed to deliver more robust functionality for companies that require advanced BI capabilities. |
| Enterprise Plan | Pricing available upon request (contact the company for a quote) | This plan offers maximum flexibility and scalability for large organizations. It is intended for companies that need customized features, additional storage space, and support for a greater number of users. |
| Plan | Price | Description |
|---|---|---|
| Free Account | Free | Ideal for individual users who want to create interactive reports and visual analytics. The free account is included with the free Microsoft Fabric account and allows users to create reports, but to share them you need to upgrade to a paid plan. No credit card is required to sign up. |
| Pro | $14 per user/month | Designed for teams that need to access and share BI reports and dashboards. It includes the ability to publish and share reports and is also available with Microsoft 365 E5 and Office 365 E5 subscriptions. This plan is ideal for companies that want to collaborate on shared reports. |
| Premium | $24 per user/month | This plan is designed for data professionals who need enterprise-grade features and advanced performance. It includes all Power BI Pro features, plus additional benefits such as larger model sizes, more frequent data refreshes, and premium analytics capabilities. It is suitable for organizations that require more robust BI tools. |
| Power BI Embedded | Variable pricing (contact sales for more details) | Designed for businesses that want to embed Power BI reports into their applications. It enables users to create branded reports, dashboards, and analytics for customers, with automated deployment and reduced workload for developers. Suitable for organizations looking to integrate BI capabilities into customer-facing solutions. |
Qlik vs. Power BI: The Verdict
So, we come to the fateful question: which of them to choose?
As always, the answer depends on the specific needs of your organization, your budget, the technological ecosystem already in use and the level of technical expertise available. Both tools are excellent, but they stand out in very, very different settings.
Our vote in this case goes to Power BI, for several reasons.
We could simply say that it is highly valued by both Gartner and Forrester — and although Qlik is gaining ground, it has yet to compete with established rivals — but the main reasons are other:
- It is a subscription service: There are no hidden costs with Power BI, unlike Qlik Sense’s licensing and enterprise cost models. In the long term, we find the costs of Power BI to be quite reasonable, considering the additional benefits…
- Cross-platform support: We’re big supporters of multiexperience and omnichannel approaches, so an omnichannel BI platform is essential. Power BI supports reports regardless of the operating system, including Android and iOS devices!
- More intuitive backend and equally easy to learn frontend: The simple commands and phrases in Power BI are more like a Google search. It’s much more intuitive for those who aren’t technical. In addition, the learning curve of the DAX language is significantly lower than that of the languages used by Qlik.
- Highly customizable: Thanks to drag and drop, ease of use, and many other factors, it’s easy to create ideal dashboards. And if you have to be a little more technical, like all modern Business Intelligence solutions, it’s also very API-friendly (developers publish on GitHub).
- It works great on mobile: Power BI is very mobile-friendly and this, in a future increasingly oriented to portability and working on the go, is a great advantage to take into serious consideration.
Second, the problems of the old QlikView are widely known and many of these problems are still encountered even with Qlik Sense:
- The price increases if you want extra functionality: The more you advance, the more the price increases make Qlik Sense much less attractive — while alternatives like Power BI become much more attractive.
- It is a more closed environment: Few integrations mean you can’t connect other systems or tools that your business might use. Closed systems of this type are not ideal for the larger data flow.
- Complicated backend: We’ve seen that the frontend is fairly simple to use, but the backend work is extremely tiring. — You’ll need a developer to create dashboards and reports. With the expansion, this will translate into higher costs and necessary resources.
- Not particularly scalable. Users with simple needs — and without strong IT resources — will struggle. Qlik Sense and the surrounding ecosystem are all designed especially for large organizations.
- Requires 4 different applications: If you are oriented towards minimalism, having to install and use several different applications is far from ideal. — There are no key features, such as bookmarks, that could really promote user independence.
- Too basic UI: As far as UX and visuals are concerned, Qlik seems very dated. Power BI is much more customizable, so you can easily adapt it to both your visual needs and data requirements.
Although there are therefore viable application cases for Qlik Sense, especially in large companies, the Microsoft Business Intelligence platform wins the comparison by virtue of its versatility and wide scalability, making it a much more attractive option in the long term for companies and businesses of all sectors and sizes.
Conclusions
There’s a reason why the Business Intelligence market is growing so fast: data is gold waiting to be extracted, and sitting on it doing nothing is probably the best way to miss opportunities as valuable as your revenue.
This is why it is important to find the right tool finally to be able to use them properly and the choice of this tool should not be taken lightly, but carefully observed and studied in order to find the most suitable solution not only for the current moment but also for the near future of your business.
To date, this tool seems to be Microsoft Power BI and the Redmond company’s Business Intelligence platform continues year after year to grind support with companies of all sectors and sizes and consolidating its position as one of the market leaders. So why wait to try it out?
FAQs about Qlik and Power BI
1) What is the main difference between Qlik Sense and Power BI? Qlik Sense is based on an associative engine that enables non-linear exploration across related and unrelated data, while Power BI primarily relies on relational data modeling and calculations using DAX, with strong integration into the Microsoft ecosystem.
2) Which of the two is more suitable for non-technical users? In general, Power BI is very accessible for report creation thanks to its drag-and-drop capabilities, although it may require more advanced skills when it comes to data modeling and using DAX. Qlik Sense offers a less technical frontend and a smooth user experience, but backend work and data modeling often require more specialized expertise.
3) Which solution is better for self-service analytics? Both support self-service analytics, but with different approaches. Qlik Sense focuses on exploration driven by data associations, while Power BI relies on interactive reports and dashboards built on a well-defined data model that enables consistent analysis.
4) Does Power BI work only in Microsoft environments? No. While integration with Microsoft 365 and Azure is a major advantage, Power BI supports a wide range of data sources and multiplatform scenarios, including mixed environments and access from mobile devices.
5) Which tool offers more visualization and customization options? Power BI tends to offer greater variety thanks to native visuals and custom visuals available in the marketplace, with very detailed formatting controls. Qlik Sense provides solid interactive visuals, themes, and extensions, and is particularly effective for analysis based on selections and contextual relationships.
Written by
Davide Mazzoli
Modern AI Apps · Dev4Side
Dev4Side Software · Microsoft Gold Partner
Need help implementing this in your company?
Our specialist teams have delivered 200+ Microsoft implementations across Italy. Contact us for a free, no-obligation evaluation of your project.
Related articles
Microsoft Purview Compliance Manager: Compliance without complications
Discover Microsoft Purview Compliance Manager, the tool that can help your company to easily meet compliance requirements.
Microsoft Security Awareness Training: all the official resources
Discover the official Microsoft resources for Security Awareness Training and how to strengthen the company's security posture starting with employees.
Microsoft Defender for IoT: what is it and how it works
An introductory overview of how Defender for IoT can help your company secure its industrial networks and critical infrastructure.