
Azure Monitor: What It Is, How It Works and What It's For
Azure Monitor collects metrics, logs and traces from Azure resources, applications and hybrid environments into a single observability platform. Features, architecture and costs.
Azure Monitor: what it is
Azure Monitor is Microsoft Azure’s native observability service. It collects metrics, logs, distributed traces and events from cloud resources, hybrid infrastructure and applications, and brings them into a single data platform used to build dashboards, queries, alerts and, more recently, AI-assisted workflows too.
It isn’t a standalone product. The same data platform that powers Azure Monitor is also the foundation Microsoft Sentinel (for security) and Defender for Cloud run on, which means anyone who invests time in setting up data collection properly with Monitor already has that data ready to reuse elsewhere, without collecting it twice.
In brief
- Azure Monitor unifies metrics, logs, traces and events from Azure resources, hybrid infrastructure and applications into a single data platform
- It’s built on two types of workspace: Log Analytics (logs and traces, queried in KQL) and Azure Monitor workspace (Prometheus/OpenTelemetry metrics, queried in PromQL)
- Application Insights, part of Azure Monitor, adds application performance monitoring (APM) and, as of 2026, monitoring for AI agents built on Microsoft Foundry and Copilot Studio
- Alerts connect metrics and logs to notifications or automation (Logic Apps, runbooks, webhooks), with an AIOps layer that cuts noise by grouping related signals
- The main cost driver is the volume of data ingested into logs, with the first 5 GB per month free and commitment discounts for teams that exceed certain daily thresholds
How Azure Monitor works: architecture and data platform
At the center of Azure Monitor is a centralized data platform, built to ingest telemetry from very different sources and make it queryable through a consistent language. This platform runs on two types of workspace which, despite the similar name, are two distinct things with different query engines.
Log Analytics workspaces collect logs and traces. Data inside them is queried with KQL (Kusto Query Language), a language purpose-built for scanning large volumes of textual and structured events, finding patterns and correlating information from different sources.
Azure Monitor workspaces, on the other hand, collect metrics in Prometheus and OpenTelemetry format. They’re queried with PromQL, the same language used by the open-source Prometheus ecosystem, and they’re the reference point for anyone already working with containers, Kubernetes and cloud-native stacks.
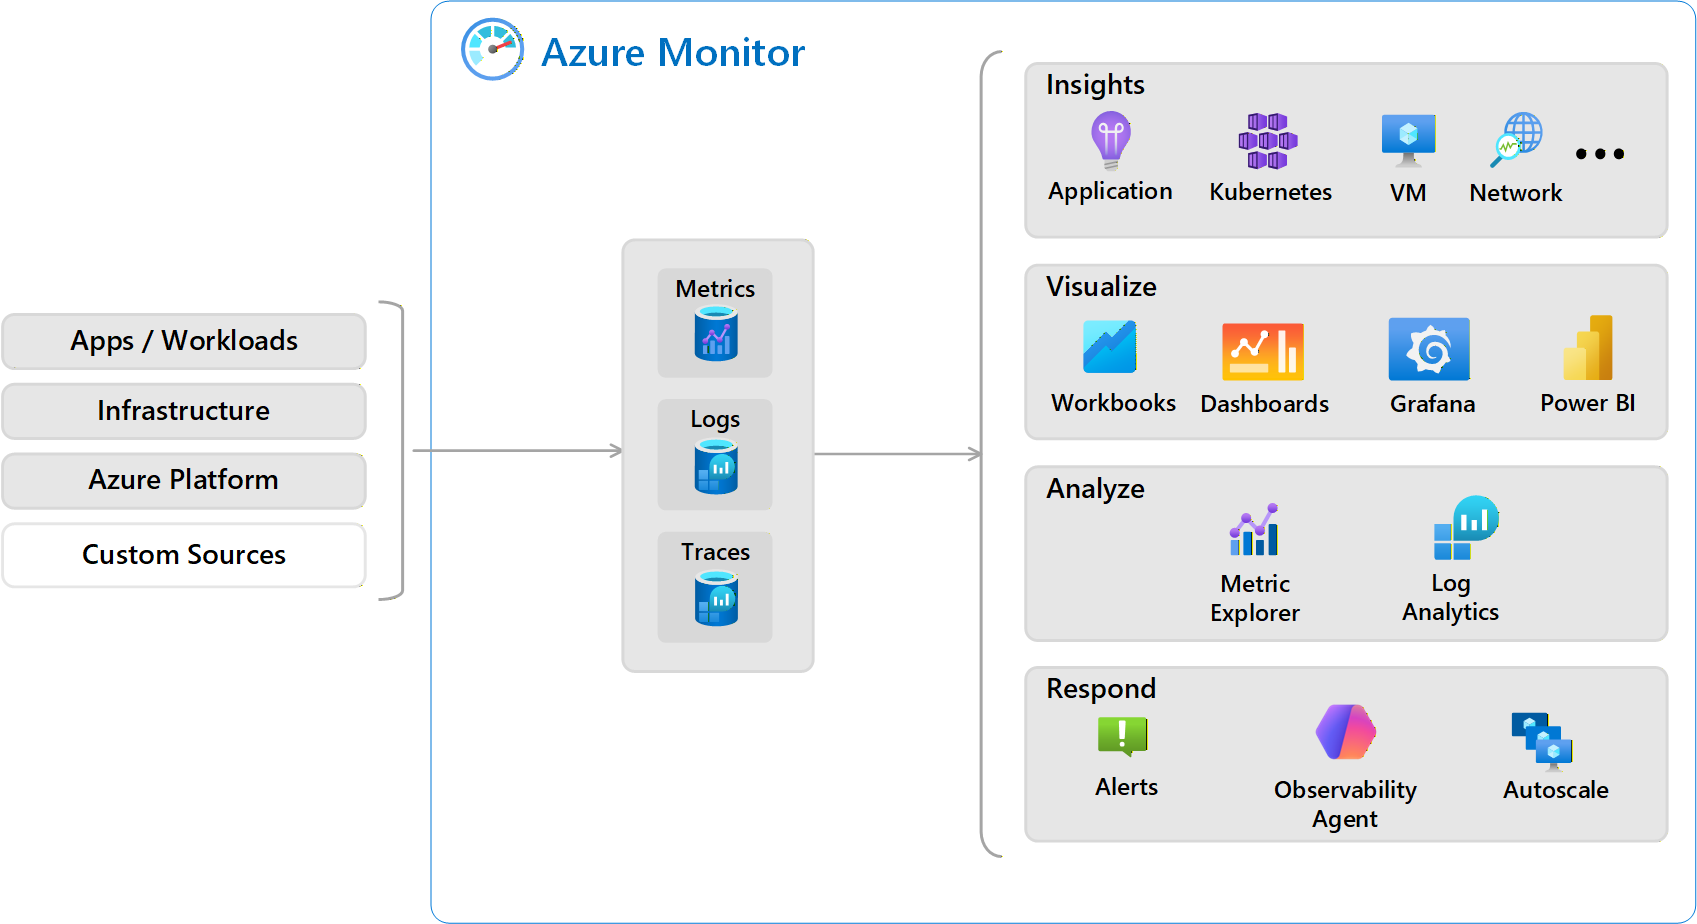 Azure Monitor architecture
This split isn’t a minor technical detail. It means an organization can keep log governance (who can read them, where they’re retained, for how long) separate from governance of high-frequency metrics, choosing the retention plan and cost model that fits each one best.
Resources connect to these two platforms through different collection mechanisms. For PaaS resources (App Service, managed databases, networking services) baseline metric and log collection is already active with no extra configuration. For virtual machines, on-premises servers and hybrid clusters, you instead need the Azure Monitor Agent (AMA), installed according to data collection rules that define what to collect and where to send it. The agent replaced the earlier Azure Diagnostics extension and Log Analytics agent, both retired during 2026.
Azure Monitor’s core features
Metrics and metrics explorer
Metrics are numeric values collected at regular intervals: CPU, memory, network latency, database throughput. Metrics explorer lets you visualize them, filter by dimension and build ad hoc charts without writing a query, a quick starting point for spotting whether a resource is behaving abnormally before even opening the logs.
Logs and Log Analytics
Log Analytics is the tool for querying data in Log Analytics workspaces. As of 2026 it offers two working modes aimed at different audiences: a simple mode, with a spreadsheet-like interface for filtering and aggregating data without knowing KQL, and a full KQL mode for anyone who wants to build advanced queries, reusable functions and complex correlations across tables.
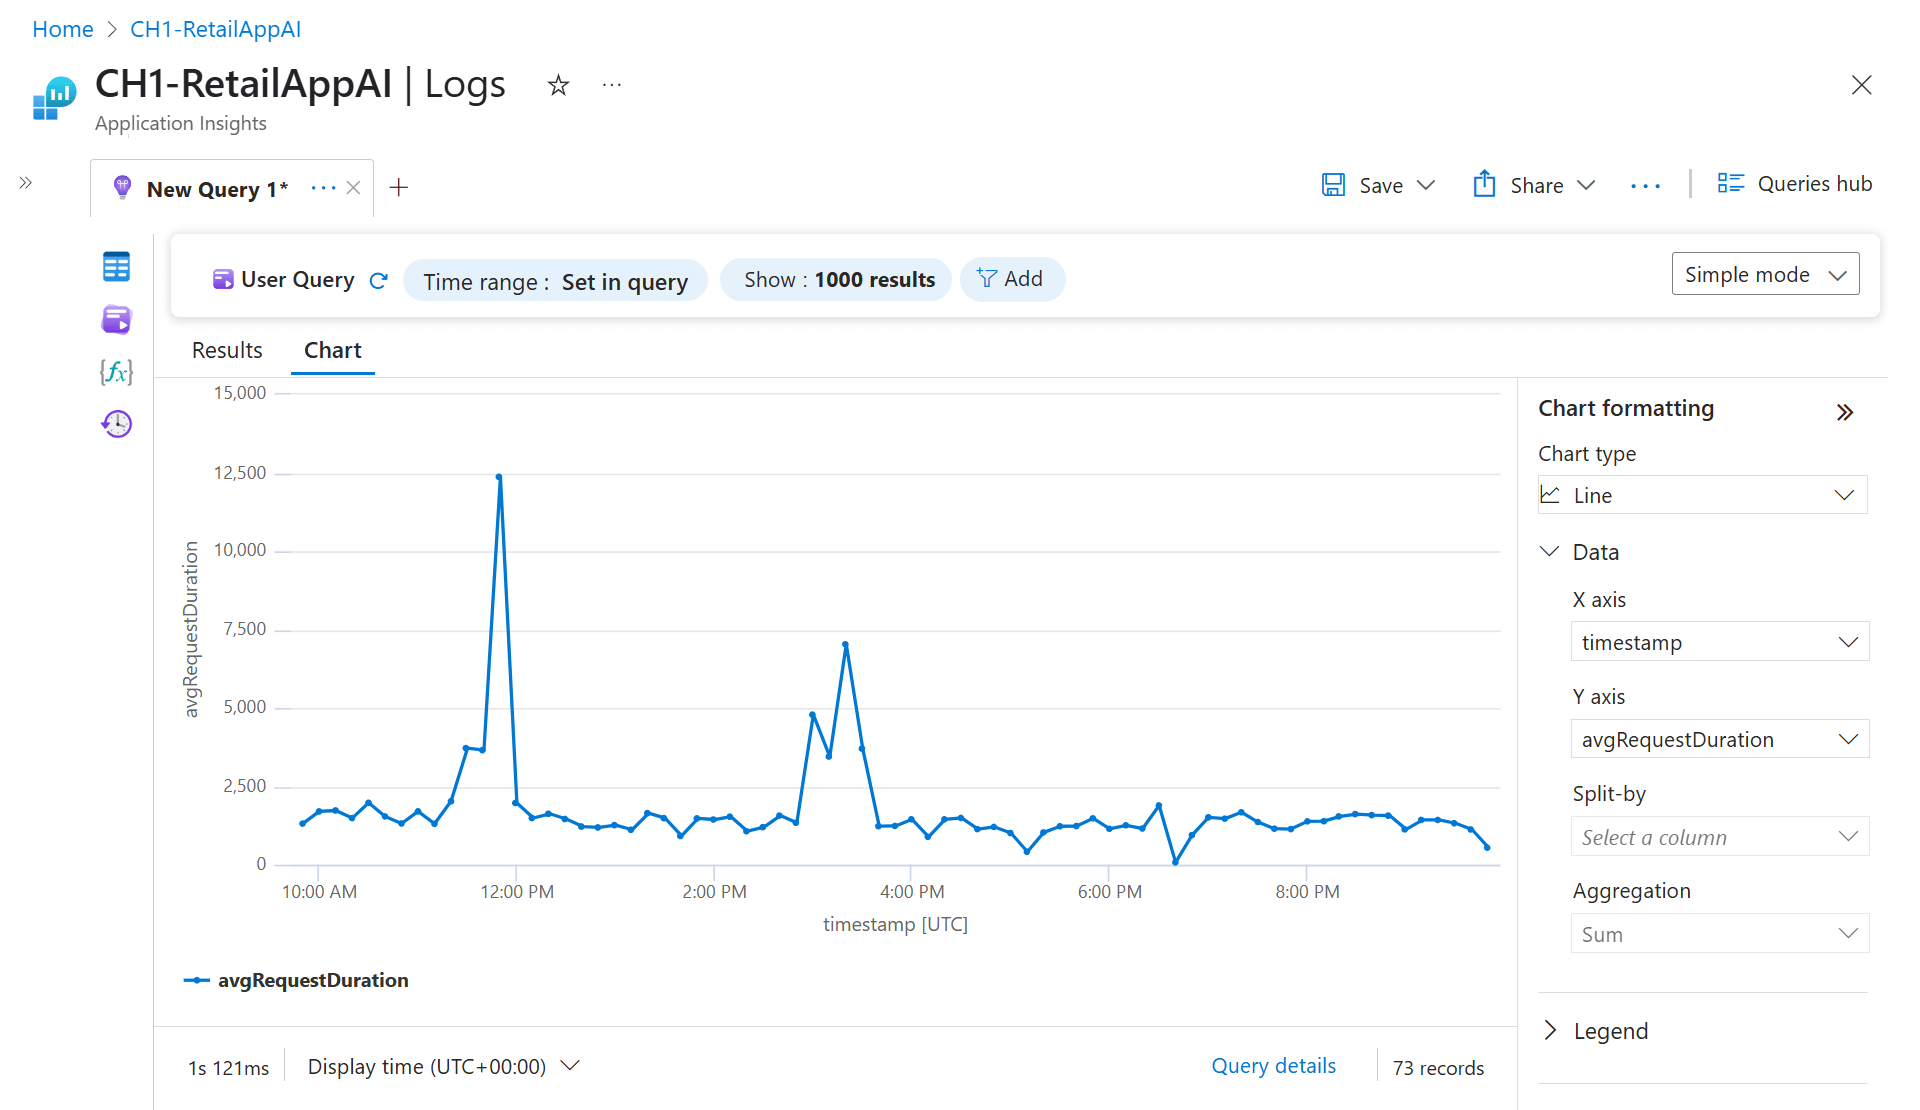 Chart view in Log Analytics
One underrated feature that matters in daily use is query history, which keeps up to 300 queries per user per resource over the last 30 days, organized by region and workspace. Anyone working with the same environments every day saves real time by not having to rewrite their most-used queries.
Application Insights and application monitoring
Application Insights is the Azure Monitor component dedicated to Application Performance Monitoring (APM). It integrates with OpenTelemetry, the open standard for collecting application telemetry, and lets you follow a request across its entire call chain, from frontend to database, pinpointing where latency builds up or where an error originates.
A notable 2026 addition is monitoring for AI agents. Application Insights now offers a unified experience for observing agents built on Microsoft Foundry, Copilot Studio and third-party frameworks, with dashboards showing token consumption, latency, error rate and response quality scores. For teams taking their first language-model-based agents into production, this matters: traditional application monitoring doesn’t capture metrics like token consumption or perceived response quality, while this extension to Application Insights does.
Alerts and action groups
Alerts connect a condition (a metric crossing a threshold, a log query returning certain results, an event in the activity log) to one or more actions: an email or SMS notification, a webhook, an Azure Automation runbook, a Logic Apps flow, or opening an ITSM incident.
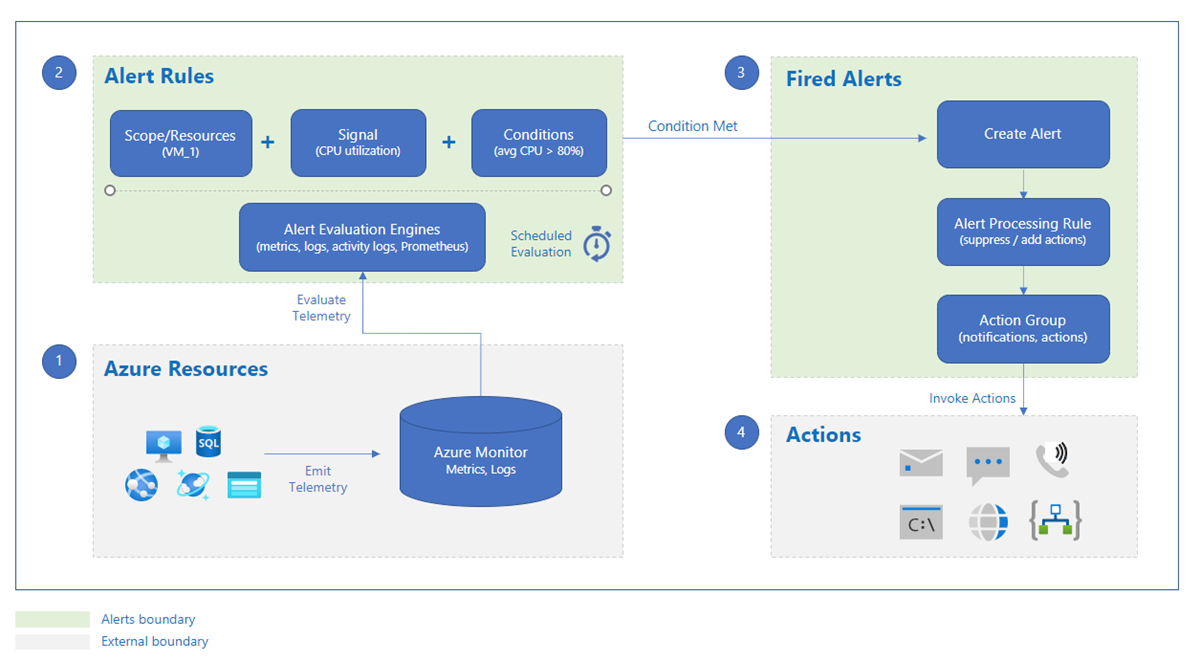 Alert rule flow in Azure Monitor
There are several alert types, each built for a specific scenario. Metric alerts evaluate numeric values at regular intervals and support dynamic thresholds, which adapt automatically to a resource’s historical behavior instead of requiring a fixed threshold chosen by hand. Log alerts run a KQL query on a schedule. Activity log alerts fire when a specific event happens, such as a network rule change. There’s also a smart detection layer that automatically flags unusual performance anomalies or errors in applications monitored by Application Insights, with no threshold to configure upfront.
A classic problem for anyone managing many resources is alert noise: dozens of notifications for what’s actually a single incident. Azure Monitor tackles this with an AIOps layer that automatically groups related alerts into a smaller number of “issues,” complete with context and evidence, designed to cut the time an on-call team spends figuring out what actually happened before they even start fixing it.
Workbooks, dashboards and visualization
For visualization, Azure Monitor provides built-in workbooks, customizable dashboards in the Azure portal, and integration with managed Grafana. Workbooks combine text, queries and charts into a single interactive document, useful for building operational reports a team can consult without writing anything from scratch each time.
Autoscale
Autoscale automatically adds or removes compute instances based on observed load, with rules based on metrics, a time schedule, or a combination of both. It’s one of the most direct applications of the data Monitor collects: not just watching what happens, but acting on it without manual intervention.
Monitoring hybrid and multicloud environments
Azure Monitor isn’t built only for resources living inside Azure. Through Azure Arc you can project servers, virtual machines and Kubernetes clusters running on other clouds or on-premises into the same control plane, and monitor them with the same tools used for native Azure resources.
For particularly large data volumes, or environments with intermittent connectivity, there’s also the Azure Monitor pipeline, designed to extend data collection into your own data center without depending on a constant internet connection to Azure. This is a typical scenario for manufacturing companies or remote sites, where data still needs to be collected even when the link to the cloud temporarily drops.
Azure Monitor, Microsoft Sentinel and Defender for Cloud: how they differ
It’s common, talking to people new to the Azure ecosystem, to hear Azure Monitor confused with the platform’s security tools. The distinction is actually fairly clear once you start from the right place: Azure Monitor watches performance, availability and resource health, while Microsoft Sentinel and Defender for Cloud use that same data (plus a lot more) to detect and respond to security threats.
Sentinel, specifically, relies directly on the Azure Monitor data platform for log collection and storage, which means the two services share their foundations rather than compete for the same purpose. Anyone who wants a deeper look at how Sentinel positions itself relative to Monitor and Defender for Cloud can read our dedicated guide on Azure Sentinel.
Azure Monitor pricing: how costs work
Azure Monitor’s cost mainly depends on the volume of data ingested into logs. The first 5 GB per month are free for every workspace. Beyond that threshold, the reference price for Analytics-tier logs (the ones fully queryable with KQL) sits around $2.30 per GB in most regions.
For predictable, high-volume needs, there are two alternative tiers designed to cut costs when you don’t need the full query power of Analytics logs:
- Basic Logs, for data mainly used for occasional troubleshooting, at roughly $0.50 per GB
- Auxiliary Logs, for very low-priority data rarely needed, at roughly $0.05 per GB
On top of that come retention costs, with a higher rate for interactive retention (up to 2 years) and a lower one for long-term retention (up to 12 years), aimed at organizations with compliance requirements that call for keeping data archived well beyond what day-to-day operations need.
Teams that exceed certain daily thresholds can also choose a commitment tier, committing to a fixed daily data volume in exchange for a discount that grows with volume: roughly 15% at 100 GB/day, 20% at 200 GB/day and 30% at 500 GB/day. Beyond logs, you also need to factor in Application Insights costs (tied to the volume of application telemetry collected) and alert costs, billed based on the number of time series or rules evaluated. For a precise estimate, tailored to your region and expected volume, the official Azure Monitor pricing page remains the most reliable reference.
Best practices for getting started with Azure Monitor
Before turning on large-scale data collection, it’s worth setting a few ground rules that avoid both visibility gaps and needlessly inflated log bills.
- Start with one data collection rule per resource category, instead of collecting everything indiscriminately. Not every virtual machine needs the same level of log detail.
- Turn on recommended alerts first, available for virtual machines, AKS clusters and Log Analytics workspaces, which Microsoft already proposes pre-configured based on the most common signals, then refine with custom rules only where it really matters.
- Separate high-priority data from troubleshooting-only data, using the Basic and Auxiliary Logs tiers for anything that doesn’t need daily complex KQL querying.
- Use Azure Policy to apply monitoring rules at scale, instead of manually configuring every single resource as it’s created.
- Connect alerts to well-designed action groups, with clear escalation paths, instead of sending every notification to a single inbox nobody checks closely enough.
Conclusion
Azure Monitor isn’t the kind of service you notice while everything is working, and that’s exactly why it’s easy to underestimate how important it is until you actually need to figure out why an application went down at three in the morning. Once set up properly, the difference between an incident resolved in ten minutes and one that drags on for hours is enormous.
The fact that the same data platform also powers Sentinel and Defender for Cloud is, in our view, one of the strongest arguments for investing time in getting the setup right from the start: the data collected today for operational monitoring is often the same data a security investigation will need tomorrow. If your organization is working out how to set up observability on Azure, or wants to integrate monitoring with an existing hybrid environment, our team can help design an architecture that doesn’t just collect data, but makes it genuinely useful for the people who have to make decisions every day.
FAQ about Azure Monitor
What is Azure Monitor in simple terms? It’s the Microsoft Azure service that collects metrics, logs and traces from cloud resources, hybrid infrastructure and applications, and makes them available in a single platform for analysis, dashboards and alerts. It isn’t a standalone product: it’s the data layer that Microsoft Sentinel and Defender for Cloud also rely on.
How much does Azure Monitor cost? The first 5 GB per month of ingested logs are free. Beyond that threshold, the standard cost for Analytics-tier logs is roughly $2.30 per GB, with discounts up to 30% for teams that commit to fixed daily volumes (commitment tier). Application Insights, alerts and workbooks add separate cost items, tied to data volume and the number of active rules.
What’s the difference between Azure Monitor and Microsoft Sentinel? Azure Monitor watches resource performance and availability, while Sentinel uses that same data (and more) to detect security threats with a SIEM/SOAR approach. Sentinel actually relies on Azure Monitor’s data platform: they aren’t two alternatives, they’re two different layers of the same stack. The full comparison is in our Azure Sentinel guide.
Do I need to install an agent to use Azure Monitor? For Azure PaaS resources, baseline collection is already active. For virtual machines, on-premises servers and hybrid environments you need the Azure Monitor Agent (AMA), which replaces the older Log Analytics and Diagnostics agents (now retired). The agent is deployed via data collection rules, including at scale with infrastructure-as-code templates.
Does Azure Monitor work outside of Azure too? Yes. Through Azure Arc you can connect machines and Kubernetes clusters on other clouds or on-premises and monitor them with the same tools used for native Azure resources. For very large data volumes or intermittent connectivity, there’s also the Azure Monitor pipeline, designed to bring data collection into your own data center.

Written by
Emanuele Rossi
Infra & Security · Dev4Side
Dev4Side Software · Microsoft Gold Partner
Need help implementing this in your company?
Our specialist teams have delivered 200+ Microsoft implementations across Italy. Contact us for a free, no-obligation evaluation of your project.
Related articles
Azure Sentinel: What it is, features, and costs
Azure Sentinel: cloud-native SIEM/SOAR for threat detection in Microsoft Azure. Features, integration with Defender, and a clear breakdown of licensing costs.
Azure Security Consulting: security consulting 'in the clouds'
Azure Security Consulting: protect your cloud with a certified Microsoft partner. What's included, why it matters, and how to choose the right consulting team.
Azure DevOps Consulting: What It Is and What It Offers
Azure DevOps Consulting: partner with a certified Microsoft expert for CI/CD and DevOps. Benefits, selection criteria, and what to expect from the engagement.